

YouTube isn’t just a stage for creativity, it’s a high-stakes laboratory where data dictates massive success.
For creators aiming to dominate, mastering advanced YouTube analytics is not optional.
The gap between viral fame and obscurity often hinges on how well you interpret the numbers hidden in plain sight.
So, let’s break down the 15 metrics that will redefine how you strategize, create, and grow.
1. Watch Time:
Watch time shows the total minutes viewers have spent watching your YouTube videos. To this day it remains YouTube’s primary signal for recommending content. Channels that rack up high watch time are rewarded with more algorithmic support.
Also, tracking shifts in this metric can reveal if new formats or topics resonate with your audience.
2. Click-Through Rate (CTR)
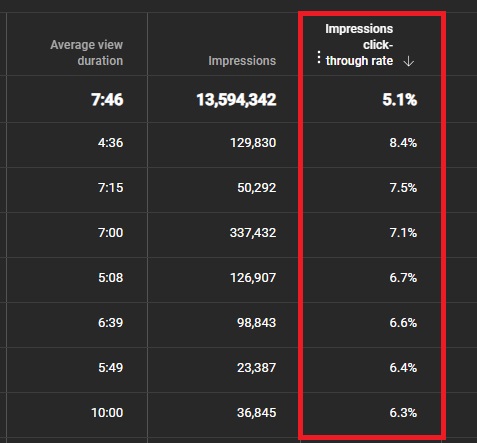
CTR highlights how often users click your video after being served an impression. This data reflects clicks from recommendations or search results. YouTube’s algorithm treats CTR as a trust signal. Hence, videos with a higher CTR receive prioritization
You can A/B test thumbnails using YouTube’s built-in tool. However, you must meet the eligibility requirements to test the tool.
3. Average View Duration (AVD)
AVD calculates total watch time divided by total viewers. This is great for getting a snapshot of engagement. Here’s a formula to help you understand the metric at a glance:
Average View Duration (AVD) = Total Watch Time / Total Number of Views
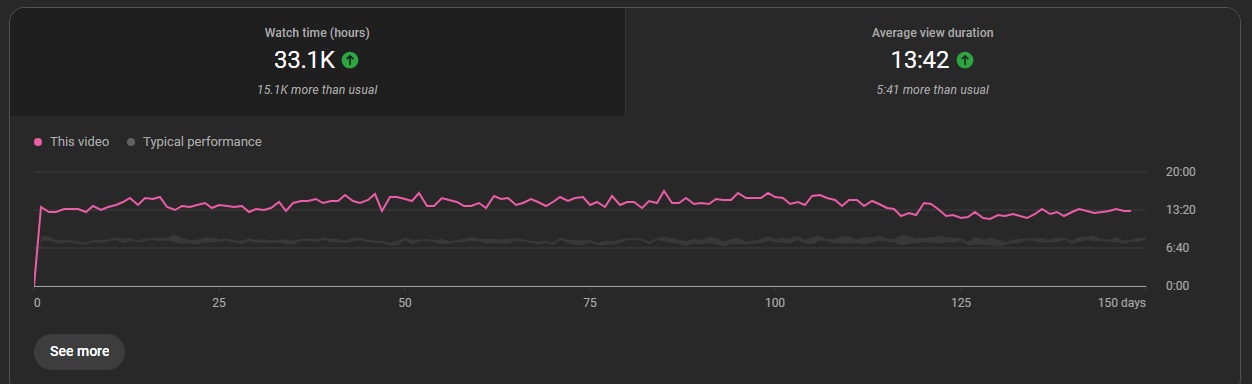
You can boost this by hooking viewers in the first 15 seconds with a clear promise. Also, use timestamps to guide them through the video.
For more help, read my guide on How to Boost YouTube Watch Time.
4. Average Percentage Viewed
This metric calculates the percentage of your video that the typical viewer watches. It does a great job of highlighting drop-off points. Spikes in abandonment around certain timestamps can be improved by:
- Adding visual interest, such as b-roll, dynamic graphics, and pop-up text.
- Tightening transitions to prevent jarring shifts.
- Cut the fat by removing redundant sections.
- Posing a question right before the drop-off.
- Previewing something interesting that will come in the next section.
5. Unique Viewers
Unique viewers estimate how many distinct users watched your content over a period. This helps differentiate between a high view count driven by repeat fans and genuine reach expansion.
The metric is important for potential brand sponsorships, since they are more interested in the audience size of your YouTube channel.
6. Returning Viewers: How to Read YouTube Analytics for Loyalty
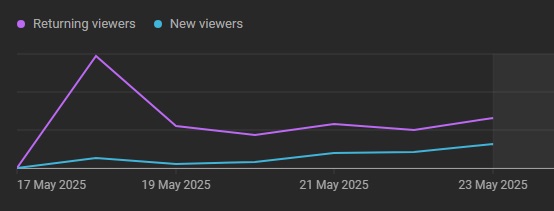
You can identify what portion of your audience comes back after an initial view by inspecting the returning viewers metric. A healthy ratio of returning to new viewers indicates strong channel loyalty.
Improving this metric involves community-building tactics. This might be ending videos with direct questions or calls to join a community tab poll. Learn how to read YouTube Analytics like returning viewers to create a loyal fanbase.
7. Traffic Sources
Traffic sources break down where views originate.
Here’s an example of the different sources you might see:
- Search
- Suggested Videos
- External links
- Playlists
- Product pages
- Notifications
- Shorts
- End Screens
Ideally, you’ll have a good spread of traffic sources, since it indicates a holistic growth plan. Poor performance in any one of these should trigger an investigation into the cause.
8. Subscriber Growth
Tracking net subscribers (gains minus losses) highlights content alignment with audience expectations. However, a sudden drop in subscribers after a video goes live could mean you’ve strayed from your niche.
You’ll need more subscribers to boost your YouTube earnings and attract bigger brand sponsorship deals. For more help on monetization, check out my guide on How to Increase YouTube RPM.
9. Engagement Rate
Engagement rate aggregates likes, comments, and shares relative to views. Then there’s engagement velocity, which measures how quickly these metrics accumulate.
A surge in activity within the first hour signals the algorithm to push your content further. You can jumpstart this by teasing the video in your Community tab with polls or behind-the-scenes snippets.
10. End Screen Clicks
You know the video suggestions that appear at the end of videos? Clicks on these contribute to the end-screen clicks metric. Tracking it allows you to refine the user experience by guiding them toward playlists, subscription buttons, or partner sites.
I recommend optimizing them by:
- Persuasive CTAs & dynamic visuals: Highlight the most relevant subscribe or video elements with custom overlays and animations. This will direct viewer attention toward clickable areas.
- Optimized timing & minimal choices: Achieving this by limiting end screens to the final 8 to 10 seconds with one or two elements. Also, slow down pacing beforehand and position elements in uncluttered spaces.
11. Playlist Engagement
This metric reveals how often viewers engage with your playlists. It includes data points such as if they play the next video or skip around. High playlist engagement indicates big potential. Hence, you need to curate thematic sequences to maximize session length.
12. Revenue Per Mille (RPM) vs. CPM
RPM represents total earnings per 1,000 views (including ads, Super Chats, and memberships), while CPM reflects ad revenue per 1,000 impressions.
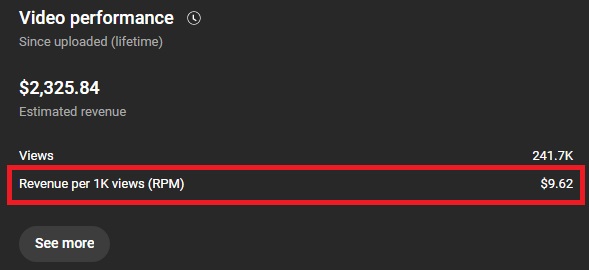
Note that a high CPM with a low RPM suggests you’re relying too much on ads and neglecting other income streams. You can diversify by promoting channel memberships, affiliate links, or exclusive content through platforms like Patreon.
13. Top Geographies and Subtitles Usage
This metric reveals where your viewers are located and how many use translated subtitles. For example, if 30% of your audience in Brazil uses Portuguese subtitles, then consider dubbing videos or creating localized content.
The cost of dubbing content with AI tools is low compared to the massive upside of accessing new audiences. It’s low hanging fruit when looking for ways to grow your YouTube channel.
14. Audience Retention
Audience Retention charts the percentage of viewers still watching at each moment in the video. Peaks and troughs in this curve uncover which segments captivate or lose interest. Use these insights to
- Tighten intros
- Reposition key messages
- Sprinkle in on-screen graphics at lag points
15. Device Type
You can learn what type of devices are used to watch your videos with this metric. For instance, knowing that 60% of your audience watches on mobile might push you to optimize visuals for small screens.
Quick Reference Table for 15 YouTube Analytics Metrics
| Metric | Location in Studio | Key Action |
| Watch Time | Analytics > Overview | Double down on content that holds attention longer |
| Click-Through Rate (CTR) | Analytics > Reach | Test thumbnails and titles |
| Average View Duration (AVD) | Analytics > Engagement | Adjust pacing or intros to boost session depth |
| Average Percentage Viewed | Analytics > Engagement | Identify and fix high dropoff moments |
| Unique Viewers | Analytics > Overview | Gauge true reach vs. repeat plays |
| Returning Viewers | Analytics > Audience | Implement community prompts to drive loyalty |
| Traffic Sources | Analytics > Reach | Shift promotion strategy based on source performance |
| Subscriber Growth | Analytics > Overview | Correlate with content types for subscriber magnetism |
| Engagement Rate | Analytics > Engagement | Use CTAs to spark more comments and shares |
| End Screen Clicks | Analytics > Engagement | Refine end screens to funnel viewers |
| Playlist Engagement | Analytics > Content > Playlists | Curate playlists for binge sessions |
| Revenue Per Mille (RPM) &. CPM | Analytics > Revenue | Monitor and negotiate sponsorship rates |
| Top Geographies and Subtitles Usage | Analytics > Audience | Dub content to target international audiences |
| Audience Retention | Analytics > Engagement | Re-edit content where retention dips |
| Device Type | Analytics > Audience | Tailor the content format |
Become A YouTube Analytics Junkie
Many successful YouTubers know their YouTube metrics inside out. It reveals what’s working, what’s not, and the areas you must target for improvement. It’s exciting getting data on your hard work, but it can also feel daunting when it’s not working out.
Do you need help boosting your YouTube metrics? Then book a consultation call with us for expert help. We can help turn YouTube channels around in any niche.
Recommended Next: How to Gain YouTube Subscribers Fast (Data Driven Growth)